
Tracking fitness progress can feel like a guessing game. You work hard, show up consistently, yet the scale barely budges or strength gains seem invisible. Without clear visualization of your improvements, motivation fades and doubt creeps in. Effective progress tracking transforms scattered data points into compelling visual stories that reveal trends, celebrate wins, and guide smarter training decisions. This guide walks you through preparing your tracking system, executing visualization techniques, and troubleshooting common pitfalls to keep you or your clients engaged and progressing toward meaningful fitness goals.
Table of Contents
- Understanding The Problem: Why Tracking Progress Is Vital
- Preparation: Setting Up For Effective Client Progress Visualization
- Execution: How To Visualize Client Progress Effectively
- Verification: Troubleshooting Common Pitfalls And Maximizing Results
- Discover MeasureMe: Your Partner For Seamless Progress Tracking
- FAQ
Key takeaways
| Point | Details |
|---|---|
| Visualization boosts motivation | Seeing progress in charts and photos significantly increases adherence and consistency in fitness programs. |
| Track multiple metrics | Weight alone tells an incomplete story; measurements, strength, and photos provide fuller insight. |
| Use apps or charts | Digital tools automate calculations and highlight plateaus, making data interpretation faster and clearer. |
| Set SMART goals first | Clear, measurable objectives define what progress looks like and keep tracking focused. |
| Balance data with context | Combine objective numbers with subjective feedback like energy levels for holistic coaching decisions. |
Understanding the problem: why tracking progress is vital
Fitness journeys stall when you can't see what's working. Individuals who consistently track fitness metrics are 3-5 times more likely to reach their goals, yet many rely on memory or sporadic weigh-ins that miss the bigger picture. Motivation thrives on visible evidence. When you document strength gains, shrinking waist measurements, or improved endurance, each data point becomes proof your effort matters. Without tracking, you might abandon a program right before breakthroughs occur.
Accountability rises sharply when tracking becomes systematic. Recording every workout, meal, or measurement creates a commitment device that discourages skipping sessions. Effective progress tracking significantly enhances motivation and adherence with 20-30% increased consistency compared to untracked efforts. This happens because visible progress triggers dopamine responses that reinforce positive behaviors.
Relying solely on weight ignores crucial changes. Muscle gain might mask fat loss on the scale, leaving you frustrated despite real improvements. Multiple data points tell richer stories:
- Body measurements reveal fat distribution changes
- Strength logs show performance improvements
- Progress photos capture visual transformations
- Subjective notes track energy and recovery quality
Maintaining engagement demands clear, meaningful visuals. Spreadsheets full of numbers overwhelm clients, while simple line graphs or photo comparisons instantly communicate progress. The key is tracking benchmarks and visualizing trends in ways that feel rewarding rather than tedious.
Pro Tip: Pair quantitative metrics with qualitative notes about how clothes fit or daily energy levels. These subjective markers often reveal progress before numbers shift, keeping motivation high during plateaus.
Preparation: setting up for effective client progress visualization
Successful visualization starts long before creating your first chart. Choose metrics that align with specific goals. A strength-focused athlete needs different tracking than someone pursuing fat loss. Weight matters, but body measurements like waist, hips, chest, and arms provide context the scale can't. Strength metrics (1RM estimates, total volume, rep PRs) show performance gains. Progress photos capture changes that numbers miss. Subjective data like perceived exertion, sleep quality, and mood round out the picture.
Setting client goals effectively involves SMART objectives aligned with needs and motivations, reviewed regularly. Specific goals like "lose 2 inches from waist in 8 weeks" or "add 20 pounds to squat 1RM by June" create clear targets. Measurable criteria let you track progress objectively. Achievable timelines prevent discouragement. Relevant metrics tie directly to desired outcomes. Time-bound deadlines create urgency and structure.
Selecting the right tools determines how easily you'll maintain tracking habits. Options range from simple to sophisticated:
- Manual logs: Paper journals or printable progress tracking sheets offer flexibility and no learning curve
- Spreadsheets: Excel or Google Sheets enable custom charts and formulas for calculated metrics
- Dedicated apps: Tools like the body measurement tracker app automate visualizations and sync across devices
- Hybrid systems: Combine app tracking with periodic photo documentation for comprehensive records
| Tool Type | Best For | Pros | Cons |
|---|---|---|---|
| Manual sheets | Low-tech preference, custom metrics | Complete control, no cost | Time-intensive, harder to visualize trends |
| Spreadsheets | Data analysis skills, complex tracking | Powerful calculations, flexible charts | Steep learning curve, manual data entry |
| MeasureMe app | Body measurements, simplicity | Automated charts, offline access, iCloud sync | Focused on measurements vs. workouts |
| Fitbod/Jefit | Strength training, workout logging | Exercise databases, volume tracking | Subscription costs, online dependency |
Data collection consistency matters more than perfection. Measure at the same time of day, under similar conditions (morning, pre-meal, post-bathroom). Use identical measurement techniques each session. Standardize photo angles, lighting, and clothing. Small variations compound over time, creating false trends that mislead decision making.
Pro Tip: Schedule tracking sessions as non-negotiable calendar events. Treating measurement days like workout appointments prevents the "I'll do it later" trap that breaks tracking streaks.
Execution: how to visualize client progress effectively
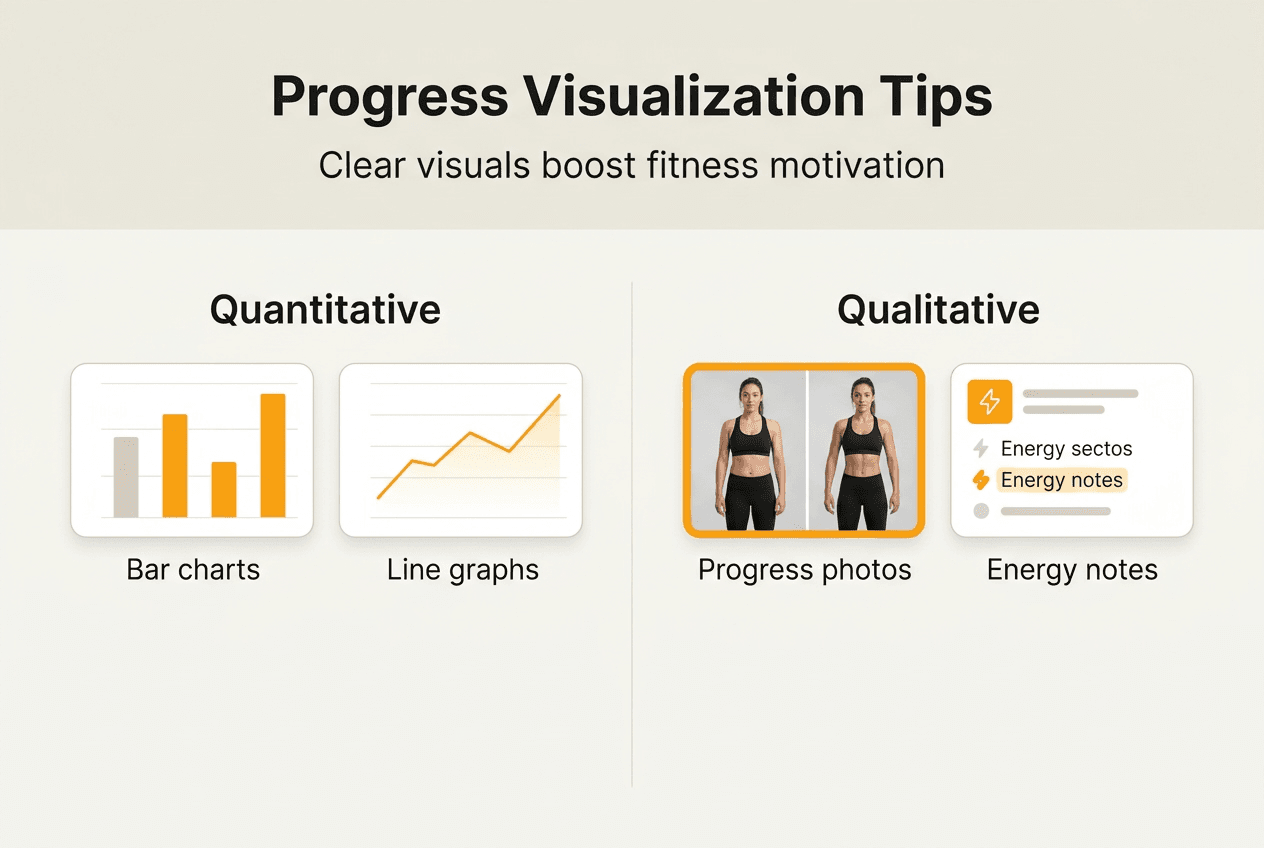
Transforming raw data into actionable insights requires choosing visualization methods that highlight meaningful patterns. Line graphs excel at showing trends over time. Plot weight or body measurements on the y-axis with dates on the x-axis to reveal whether you're trending up, down, or plateauing. Smoothing techniques like 7-day moving averages reduce daily fluctuations, making true trends clearer. Color coding different metrics on one graph (waist in blue, weight in red) enables quick comparisons.
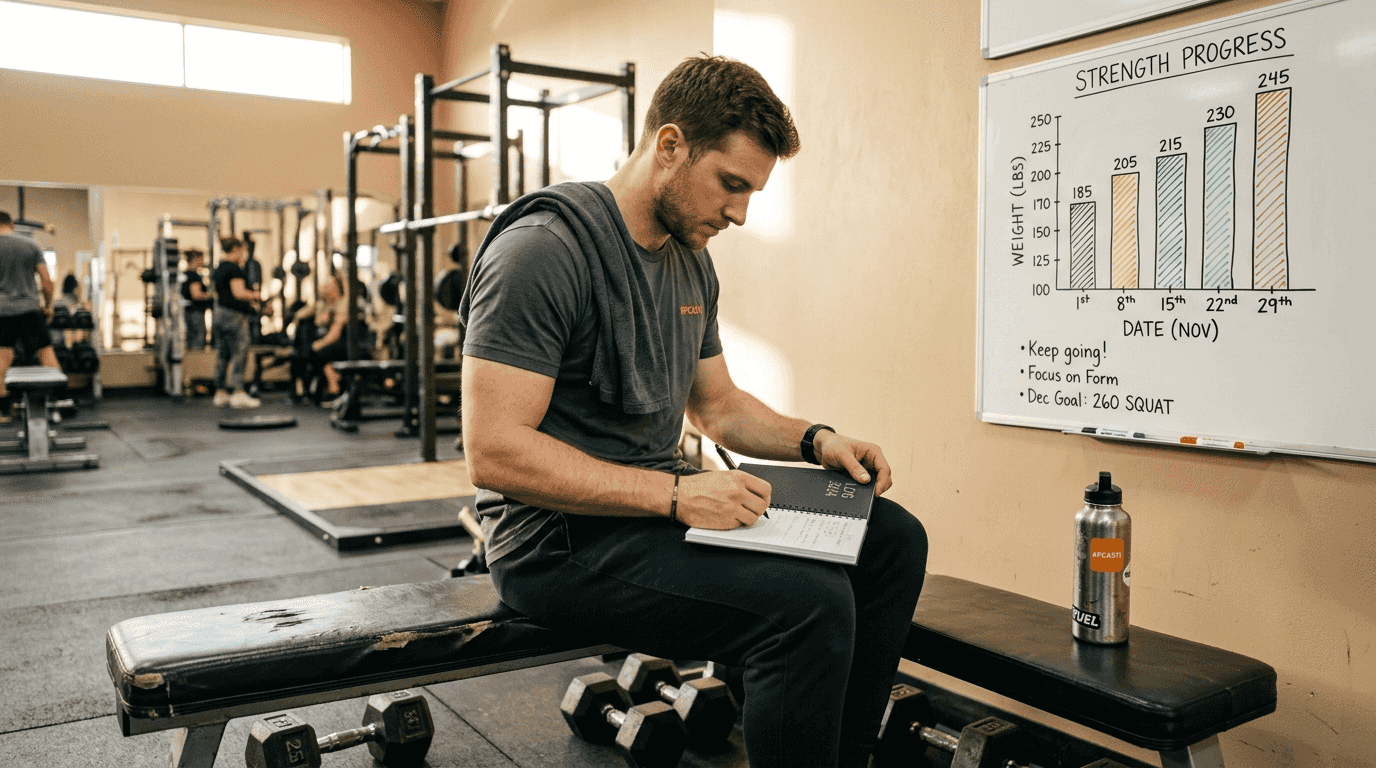
Bar charts communicate workout volume and strength progression powerfully. Stack weekly total volume (sets × reps × weight) as bars to see training load changes. Compare rep maxes across months to visualize strength gains. Side-by-side bars for different exercises reveal balanced development or lagging muscle groups.
Progress photos provide qualitative proof that numbers can't capture. Take front, side, and back photos every 2-4 weeks under consistent lighting. Grid layouts showing chronological progression create powerful before-and-after narratives. Photos often reveal muscle definition improvements or posture changes invisible on scales.
Fitbod's Results screen tracks strength gains and visualizes progress with real-time scores and benchmark tracking, automatically calculating metrics like estimated 1RM and total volume lifted. Jefit app automates tracking sets, reps, weights and visualizes performance trends, eliminating manual calculations that consume time and introduce errors. These platforms identify plateaus by flagging periods where metrics stagnate, prompting program adjustments.
| Visualization Type | Best Use Case | Strengths | Limitations |
|---|---|---|---|
| Line graphs | Weight, measurements over time | Clear trend identification, easy interpretation | Can be noisy with daily fluctuations |
| Bar charts | Workout volume, strength PRs | Emphasizes discrete improvements, good for comparisons | Less effective for continuous data |
| Progress photos | Body composition changes | Captures visual details numbers miss | Subjective, requires consistent conditions |
| Dashboard apps | Comprehensive tracking | Combines multiple metrics, automated calculations | Learning curve, potential feature overload |
Interpreting visualizations guides smarter training decisions. Upward trending strength graphs suggest your program works. Flat measurement lines during calorie deficits might indicate insufficient protein or need for diet breaks. Declining workout volume could signal overtraining or inadequate recovery. Cross-reference multiple metrics before making changes. A weight plateau with shrinking waist measurements indicates successful body recomposition, not failure.
Pro Tip: Layer subjective data like rate of perceived exertion (RPE) or daily energy ratings onto your objective charts using MeasureMe app features. When strength drops but RPE spikes, you've caught early overtraining signs before injury occurs.
Verification: troubleshooting common pitfalls and maximizing results
Even well-designed tracking systems fail when execution falters. Inconsistent data entry creates misleading visualizations that trigger poor decisions. Measuring waist circumference at different locations each week generates artificial fluctuations. Weighing yourself at varying times captures water weight swings rather than true fat loss. Common client progress tracking pitfalls include inconsistent data, lack of engagement, and failure to analyze data effectively. Standardize every measurement protocol and stick to it religiously.
Client disengagement kills tracking adherence faster than any other factor. When clients don't understand their data or see how it informs programming, they view tracking as busywork. Combat this by:
- Reviewing visualizations together during check-ins
- Explaining what trends mean for their goals
- Involving clients in setting next steps based on data
- Celebrating small wins visible only through tracking
Balancing quantitative metrics with qualitative feedback prevents tunnel vision. A client hitting strength PRs but reporting constant fatigue and poor sleep needs recovery, not more volume. Another showing slow scale movement but feeling energetic and fitting into smaller clothes is progressing beautifully despite numbers suggesting otherwise. Data informs decisions but shouldn't override human experience.
Avoiding metric overload keeps tracking manageable. New trackers often measure everything: weight, ten body sites, five strength lifts, steps, calories, macros, sleep, and mood. This creates decision paralysis and tracking fatigue. Start with 3-5 core metrics aligned with primary goals. Add complexity only when habits solidify and curiosity demands deeper insights.
"The best tracking system is the one you'll actually use consistently. Perfection in measurement means nothing if you abandon it after two weeks. Start simple, build the habit, then expand as tracking becomes automatic."
Over-reliance on data can risk a dehumanized coaching approach; balance is key. Numbers provide objective feedback, but coaching relationships thrive on empathy, communication, and understanding individual contexts. A missed workout might reflect life stress, not lack of commitment. Weight gain could signal muscle growth, not dietary failure. Effective coaches blend data-driven coaching insights with active listening and personalized support.
Pro Tip: When clients hit plateaus, zoom out your visualization timeframe. Switching from weekly to monthly views often reveals continued progress that short-term noise obscures, restoring confidence and motivation.
Discover MeasureMe: your partner for seamless progress tracking
Managing client measurements shouldn't require spreadsheet expertise or constant internet connectivity. MeasureMe body measurement tracker simplifies tracking multiple body sites with an intuitive interface that works completely offline. Your data syncs securely through iCloud, ensuring privacy while enabling access across devices. Automated visualization features transform measurements into clear trend charts instantly, helping you identify progress patterns or plateaus without manual graphing.
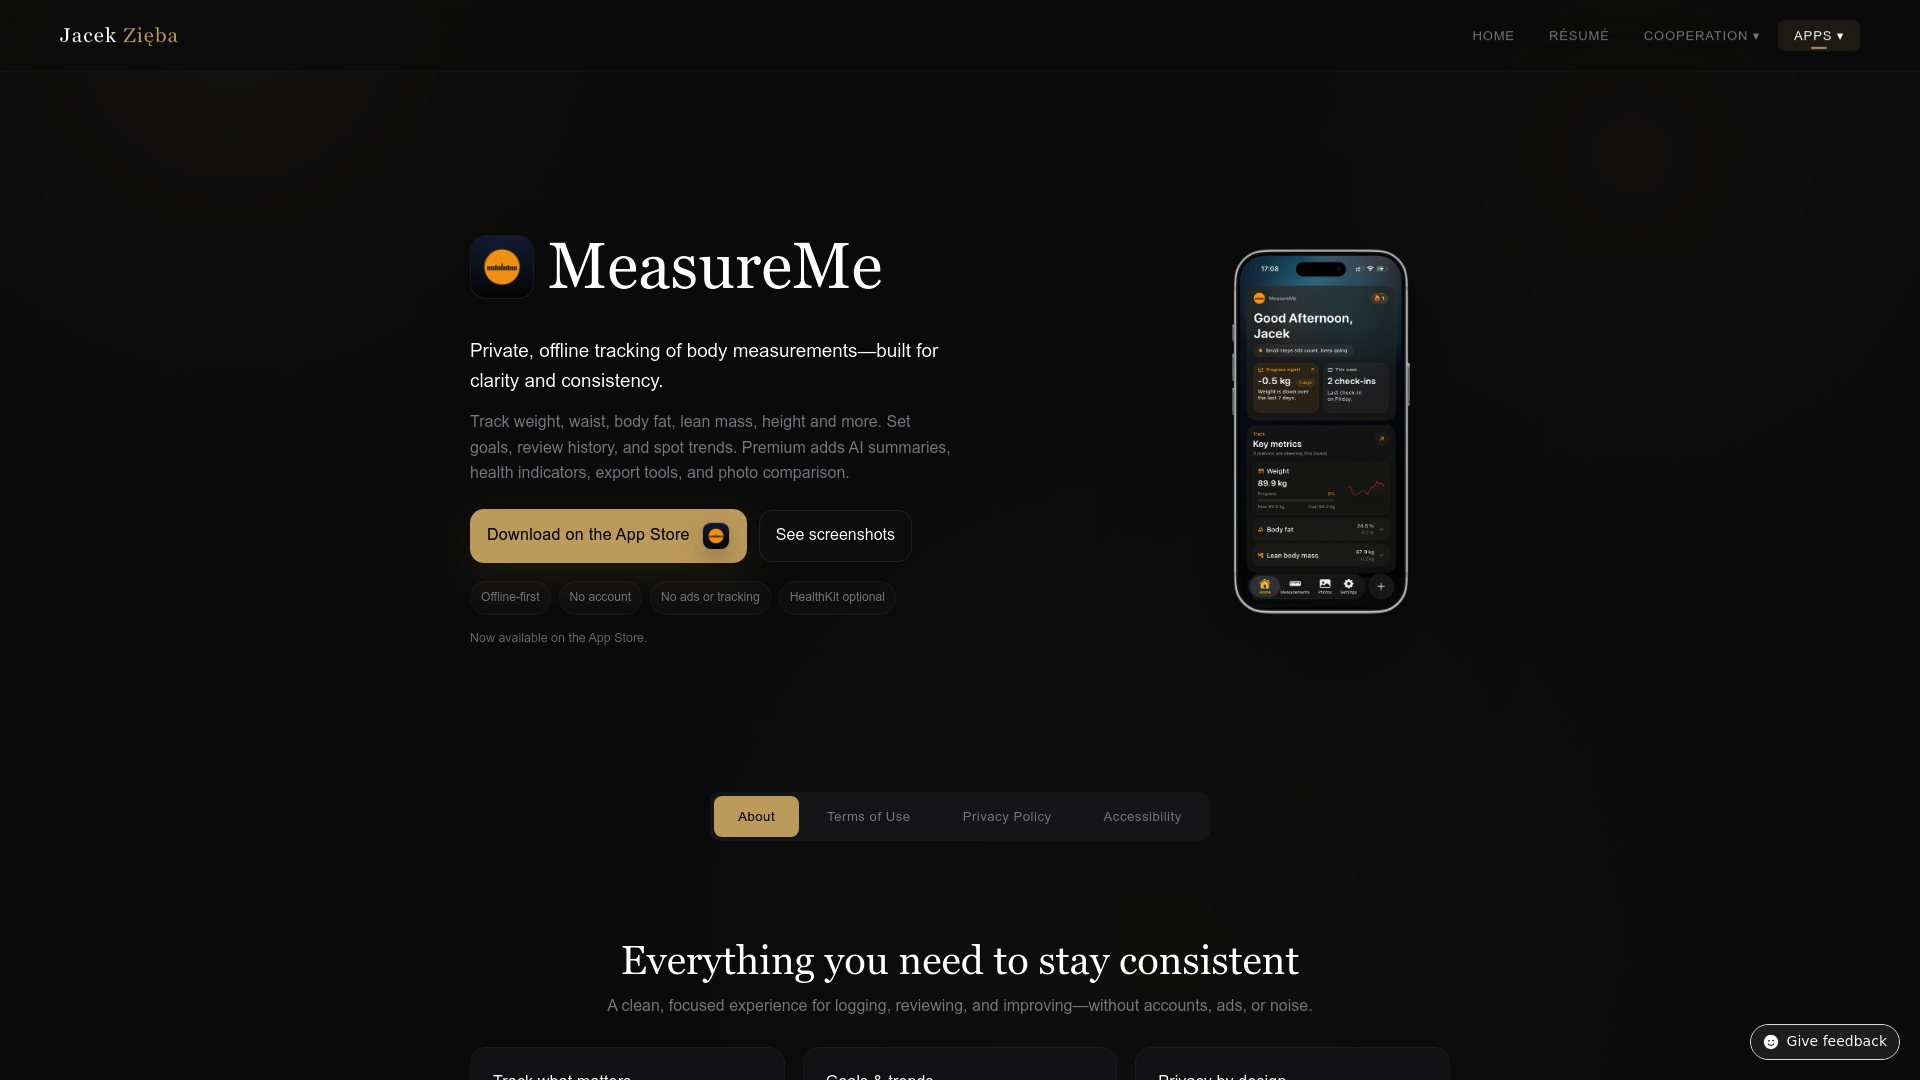
Fitness professionals trust MeasureMe for its accuracy and ease of integration into coaching workflows. Whether you're tracking personal progress or managing multiple clients, the app eliminates data entry friction that derails consistency. Focus on training and nutrition strategies while MeasureMe handles the measurement logistics. Explore how Jacek Zięba cooperation services can enhance your fitness business with smart tracking solutions that keep clients engaged and progressing.
FAQ
How often should clients update their measurements to track progress effectively?
Weekly or biweekly updates strike the ideal balance between capturing meaningful changes and avoiding obsessive tracking. More frequent measurements add noise from daily water fluctuations and don't allow enough time for real physiological changes. Monthly tracking risks missing important trends or delaying necessary program adjustments. Consistency in timing matters more than frequency, so choose a schedule you'll maintain long term.
What metrics beyond weight should be tracked for a comprehensive view?
Body measurements like waist, hips, chest, arms, and thighs reveal fat distribution changes the scale misses entirely. Strength metrics including 1RM estimates, total workout volume, and rep PRs demonstrate performance improvements. Progress photos capture visual transformations and posture changes. Subjective data like energy levels, sleep quality, workout enjoyment, and rate of perceived exertion provide context that pure numbers can't, helping distinguish between productive stress and overtraining.
How can trainers keep clients motivated during plateaus shown in progress charts?
Highlight improvements in alternative metrics when primary goals stall. If weight plateaus but waist measurements shrink or strength increases, emphasize these wins to maintain momentum. Use plateau data strategically to adjust programming, showing clients their tracking enabled smarter decisions rather than revealing failure. Zoom out visualization timeframes to monthly or quarterly views that often show continued progress obscured by weekly noise. Celebrate process victories like tracking consistency itself, which predicts long-term success regardless of short-term fluctuations.
Can progress tracking work without expensive apps or technology?
Absolutely. Simple paper logs and printable tracking sheets deliver core benefits when used consistently. Manual charts drawn on graph paper visualize trends effectively. The advantage of apps lies in automation, cloud backup, and calculation speed, not necessity. Many successful fitness transformations happen with nothing more than a notebook and measuring tape. Choose tools matching your comfort level and budget, prioritizing consistency over sophistication. Technology should simplify tracking, never complicate it to the point of abandonment.